Changing Face of Labor
November 10, 2009
Kris Warner and I have a new paper out today, "The Changing Face of Labor, 1983-2008" [pdf].
We reviewed the last 26 years of data from the Current Population Survey, starting with the earliest consistent data on unionization. Our main findings:
Women now make up over 45 percent of unionized workers, up from just 35 percent in 1983. At current growth rates, by 2020, women will be the majority of union workers.
Latinos are the fastest growing ethnic group in the labor movement. In 2008, they represented 12.2 percent of the union workforce, up from 5.8 percent in 1983.
Asian Pacific Americans have seen considerable gains and made up 4.6 percent of the union workforce in 2008, an increase from 2.5 percent in 1989.
Black workers were about 13 percent of the total unionized workforce, a share that has held fairly steady since 1983, despite a large decline in the representation of whites over the same period.
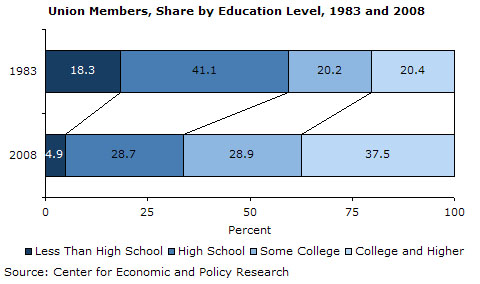
Over one-third of union workers had a four-year college degree or more, up from only one-in-five in 1983. Almost half of union women had at least a four-year college degree.
Only about one-in-ten unionized workers was in manufacturing, down from almost 30 percent in 1983.
Just under half (48.9 percent) of unionized workers were in the public sector, up from just over one-third (34.4 percent) in 1983. About 61 percent of unionized women are in the public sector.
The typical union worker was 45 years old, or about 7 years older than in 1983. (The typical employee, regardless of union status, was 41 years old, also about 7 years older than in 1983.)
More educated workers were more likely to be unionized than less educated workers, a reversal from 25 years ago.
Immigrants made up 12.6 percent of union workers in 2008, up from 8.4 percent in 1994.
In rough terms, five-in-ten union workers were in the public sector; one of every ten was in manufacturing; and the remaining four of ten were in the private sector outside of manufacturing.
And here's one of the twenty or so graphs in the report. This one illustrates the large increase in the educational attainment of the union workforce. In 1983, union workers had about the same level of formal education as the overall workforce. Today union workers have more education than the overall workforce.

UPDATE 11/11/09: The New York Times and the Associated Press have run great stories on the report. And nice posts at BusinessWeek.com's "Money & Politics", The Plank at The New Republic, and Economix at the New York Times.
UPDATE 06/06/10: A version of the report is now out in the peer-reviewed journal WorkingUSA.