Working and Uninsured
April 21, 2010
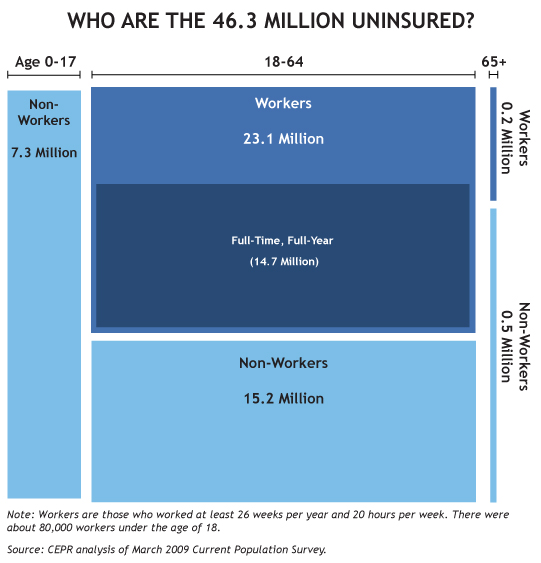
Almost everyone of us over at CEPR had some role in creating the above graph of uninsured Americans in 2008.
From the caption on the CEPR site: "The most recent available data (2008) show that 46.3 million people in the United States had no health insurance. Adults between 18 and 64 are by far the largest group of uninsured (38.3 million in 2008). Children are the next largest group of the uninsured (7.3 million). Thanks primarily to Medicare, only a small share of the uninsured are 65 or older (0.6 million). Most uninsured adults are workers. Over 23 million workers 18 to 64 have no health insurance from any source, compared to about 15 million non-working adults in the same age range. A large majority of the working adults (14.7 million) are 'full-time, full-year' (that is, worked at least 50 weeks in the year, for at least 35 hours per week)."